
Reading Claude's work
Claude Code doesn’t just reply — it works: it reads files, edits them, runs commands, searches the tree, spawns sub-agents, and launches background jobs. A plain chat log would flatten all of that into walls of text. Paddock instead renders each tool call as a compact, expandable block, and gives you two dedicated tabs — Files and Changes — for inspecting and committing what the agent left behind.
This guide is a tour of those review surfaces. For who did a piece of work (a human, a schedule, another chat), see the companion Provenance concept.
How tool calls render
Section titled “How tool calls render”Every tool Claude calls becomes a collapsible block in the transcript. The header always shows a per-tool icon, the tool name, a short subtitle (usually the target), and — on the right — a duration and any status chips. Click a block to expand its body. Blocks that carry a rich body (a diff, an image, split output) have that detail reconstructed from the transcript when the chat loads, so reading a conversation back shows the full rich rendering. (A tool call whose transcript carries no such detail simply falls back to its plain output.)
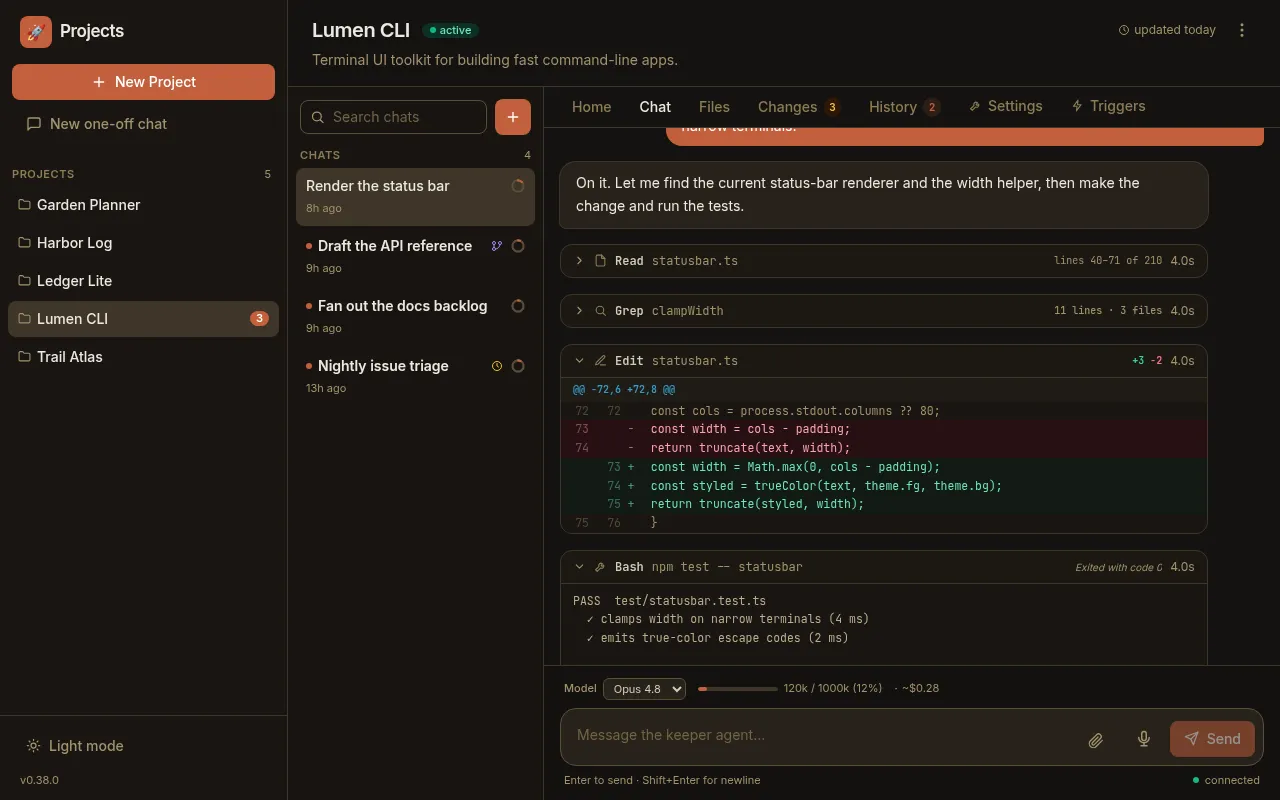
Edit and Write show a real diff
Section titled “Edit and Write show a real diff”An Edit, MultiEdit, or Write renders as a git-style diff with real file
line numbers — not a guess. Paddock reads the structured patch Claude Code
already computed, so each hunk carries its true @@ -old,n +new,n @@ header, a
left gutter of old line numbers, a right gutter of new ones, and red/green tinting
for removed and added lines. The header carries a compact +3 −2 stat (additions
in green, deletions in red). Very large diffs are capped for rendering — the stat
stays exact and a note flags that the diff was truncated.
Read shows the range — and inlines images
Section titled “Read shows the range — and inlines images”A Read block’s subtitle is the file, and its metadata shows the line range that
was read, e.g. lines 40–71 of 210. When Claude reads an image that lives
inside the project directory, the block renders the picture inline
rather than a path — so a screenshot the agent looked at is right there in the
transcript.
Bash separates stderr and surfaces the exit status
Section titled “Bash separates stderr and surfaces the exit status”A Bash block shows the command as its subtitle. When there’s more to say than a
clean stdout, the body splits stderr into its own red panel so warnings and
errors don’t hide inside normal output. The header can carry an interpretation of
the exit status (for example Exited with code 0), an amber interrupted chip
if the command was cut off, and a short hint for a recognised git operation (like
push → main). A clean command with nothing unusual just shows its output.
Grep and Glob show counts
Section titled “Grep and Glob show counts”A search collapses to its result size instead of dumping every hit: a Grep
shows something like 11 lines · 3 files (or just the file count in
files-with-matches mode), and a Glob shows N matches. A truncated result
set is prefixed with ≥ so you know the real number is larger than shown.
Sub-agents and background jobs stand out
Section titled “Sub-agents and background jobs stand out”- A
Task(or SDKAgent) call — a sub-agent — is tinted with an accent border and a sub-agent badge, with a spark icon and the sub-agent’s description as its subtitle. Its own steps and its token cost roll up into the block, and you can expand it to load the nested steps the sub-agent ran. - Anything launched detached — a
Monitor, a background-task op likeBashOutput/TaskStop/KillShell, or arun_in_backgroundcommand — gets a sky-blue background badge and a colored status chip (running,completed,killed,timed out) so long-lived async work is easy to spot and track.
Sub-agent cards fill in live
Section titled “Sub-agent cards fill in live”You don’t have to wait for a reload to see what a sub-agent is doing. The card is
enriched the instant the sub-agent launches: its real type (e.g.
general-purpose) and description are recovered from the tool call as it streams,
and a still-working sub-agent shows a running spinner where its duration will
land. Expand a running sub-agent and its nested steps appear as they happen,
refreshed every couple of seconds from the sub-agent’s own growing transcript —
and those nested steps recurse, so a sub-agent that spawned its own sub-agents is
expandable all the way down.
Two things to know about the numbers on a sub-agent card:
- Cost is the recursive total — the sub-agent plus everything it spawned, however deep. That’s what you want when you’re asking “what did delegating this actually cost.”
- Durations stay per-agent. Nested sub-agents run in parallel, so summing their durations would badly overstate the elapsed time; each card reports only its own run.
What is still running stays in view
Section titled “What is still running stays in view”Work can outlive the turn that started it, and by then the card that launched it
has usually scrolled off the top of the window — so there is nowhere to look to
find out whether anything is still happening. Paddock’s answer is a live bar
pinned just above the message box, listing every piece of running work: not
only sub-agents, but background shells, Monitors and workflows too. It stays
there no matter how far the transcript has moved on, and it renders nothing at
all when nothing is running, so an ordinary turn looks exactly as it always did.
The heading stays specific when it can: 2 sub-agents running while sub-agents
are the only kind of work in the bar, and 3 things running only on a genuinely
mixed one.
Each row carries a short bold label — the sub-agent’s type (e.g.
general-purpose), the workflow’s name, the monitored tool, or just the kind of
work — then a wide middle column saying what it is doing right now, then a
step count. For a background shell that middle column is the command it is
running; for anything else it’s the last tool it used, falling back to its
description. A row that hasn’t reported yet reads starting…. Rows sourced from
the server also carry their own elapsed clock.
Tap a row and Paddock scrolls the transcript to that piece of work’s card, expands it, and pulses it briefly so you can see which one it landed on.
The bar merges two sources, and the difference is worth knowing because it shows:
- Sub-agents come from the transcript, which is where the richer detail is: the live current step, refreshed from that sub-agent’s own transcript every couple of seconds, and a climbing step count. That same live step doubles as the collapsed card’s subtitle while the sub-agent works — so a card scrolled past in the transcript reads as what it’s doing, not a description written minutes ago. It reverts to the description once the sub-agent is done.
- Everything else — background shells, monitors, workflows — comes from the
server, which now tracks live background work per session and pushes it to the
browser as it changes. That is the first time any of them has had liveness
at all. Before it, a background
Bashor aMonitorrendered a staticrunningchip that meant only no completion notification was found in the transcript — not “we checked, and it is still going”. A killed task kept that chip forever.
A sub-agent the transcript has already found is never drawn twice; one it hasn’t found yet still appears, which is what makes reloading mid-run honest. Work the runtime marks as ambient housekeeping is deliberately left out — the bar is for work you asked for.
Two limits worth stating so they don’t read as bugs. Not every row is tappable: Paddock can only jump to a card it can identify, and a background shell launched several turns ago may carry nothing tying it to one — those rows render as plain rows rather than buttons. And the bar is per chat, showing this chat’s work; for what the rest of the instance is doing, the fleet readout sits across the top of every route.
Background work outlives the turn
Section titled “Background work outlives the turn”Since v0.43, work Claude kicks off in the background on a session-mode chat
— a run_in_background shell, a background sub-agent, a long build — keeps
running when the turn that started it ends, including on a brand-new chat’s very
first turn. When it finishes, the follow-up turn streams into the open chat
live, with no refresh.
The bar above is the live answer to “is it still going?”, and the chat is counted
as busy while it holds background work — the sidebar dot stays lit, the chat
keeps its channel in the fleet readout, and it still matches the running-only
filter. What doesn’t stay locked is the composer: a Monitor can run for an
hour, and locking the message box for that hour while animating a “working”
indicator would both make the chat unusable and misdescribe what is happening.
Errors and in-flight calls
Section titled “Errors and in-flight calls”A tool that failed is tinted rose with an error chip; a tool still running shows a spinner and a running label, which reconciles into the finished block the moment its result lands.
Paddock’s own tools render as first-class UI
Section titled “Paddock’s own tools render as first-class UI”When Claude uses Paddock’s own management tools — the mcp__… tools it can be
given to create chats, fork them, send messages between them, or list projects —
those don’t render as raw mcp__paddock_manage__create_chat noise. Each gets a
humanized name (so create_chat reads as Create chat), a Paddock
badge, and a per-tool icon.
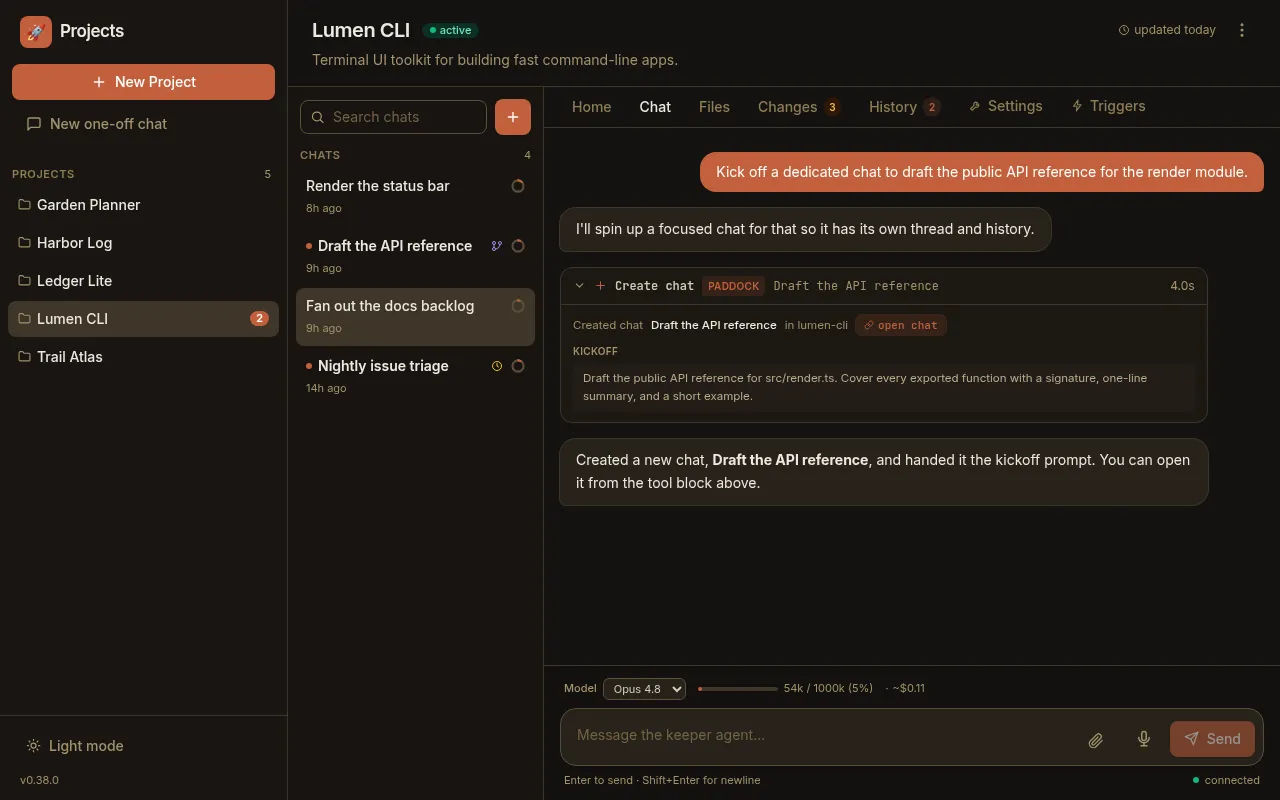
The management tools also get dedicated bodies parsed from their result: a list-projects call shows project pills; a list-chats call shows a chat list with live running dots; a create or fork call shows the chat’s real title and its kickoff prompt, and a send-message call shows the message — each with a link straight into the chat it touched.
The live context + cost meter
Section titled “The live context + cost meter”While you read, two small readouts tell you how “heavy” the chat has become. They live in the sidebar (a context ring per chat) and in the composer’s status row (a fuller context + cost line):
- Context is how full the model’s context window is — the tokens from the
last completed turn as a percentage of that model’s limit (1M for Opus,
Fable, and Sonnet; 200K for Haiku), shown like
120k / 1000k (12%). Because it reflects the last completed turn, it updates a beat behind a streaming turn, and the ring/bar turns amber as you near the top of the window. Before a chat’s first turn there’s nothing to measure, so it readscontext: —. - Cost is the chat’s cumulative token usage and an estimated dollar figure, including tokens spent by any sub-agents Claude spawned. The dollar number is a ballpark at standard API list prices — a sense of scale, not a bill; on a Claude subscription it won’t match what you’re actually charged.
The two are different kinds of number, which is worth internalising: context is a snapshot, cost is a running total. Context answers “how full is the window right now”; cost answers “what has this whole chat consumed so far”.
To see how the window filled up over the course of a chat rather than just where it stands now, hover any message — the per-message rail shows the context fill as of that point.
Browse what the agent wrote: the Files tab
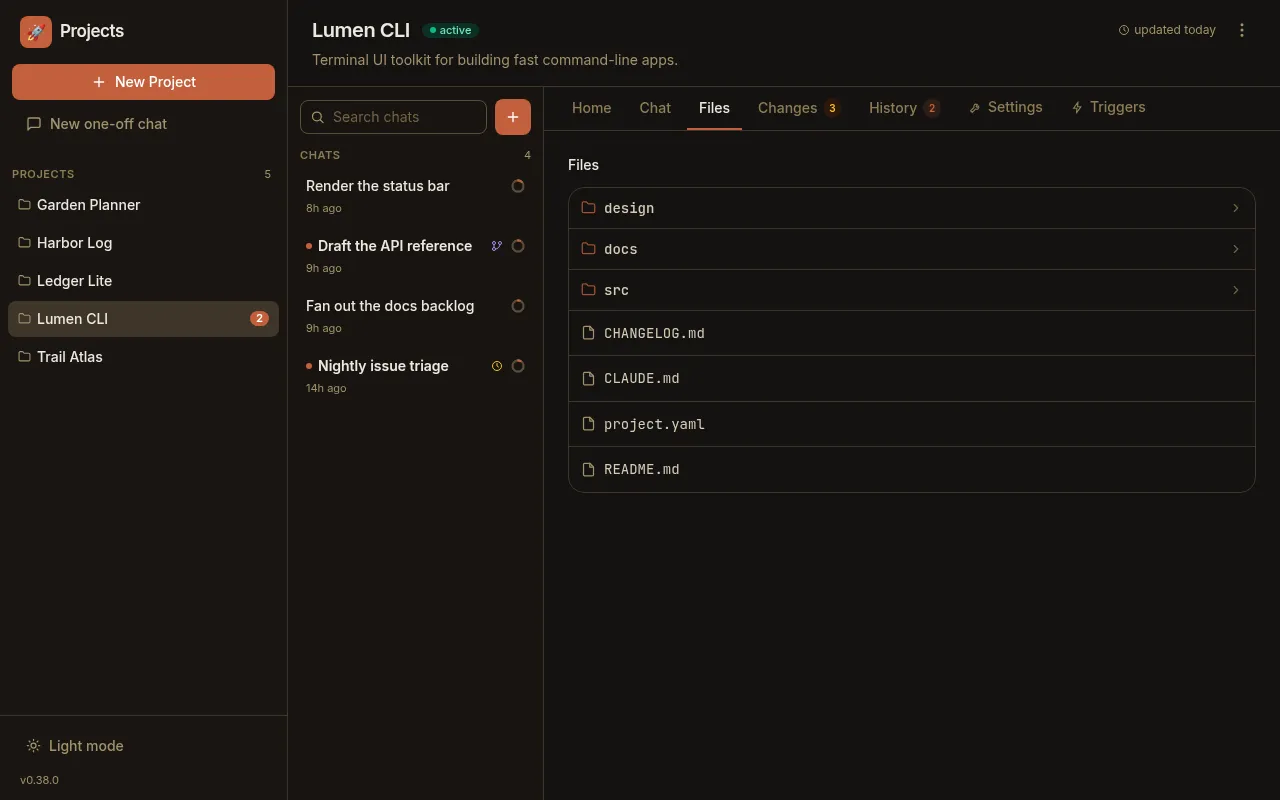
Section titled “Browse what the agent wrote: the Files tab”The Files tab lists the project’s working directory, one level at a time.
Subdirectories Claude filed things under — a docs/, design/, or src/ — are
first-class: folders are visually distinguished, sort ahead of files, and carry a
chevron. Click a folder to descend; a .. entry and a path breadcrumb take you
back up.
The current folder or file is carried in the URL as
/projects/<slug>/files/<path>, so a view deep into a subtree is
deep-linkable and survives a refresh — handy for pointing someone at exactly
the file you’re looking at. Clicking a file opens it inline.
Pin a file as a tab — at any depth
Section titled “Pin a file as a tab — at any depth”Any file you can reach through the Files browser can be pinned as a tab, from either its list row or its viewer. A pinned file then rides along in the project header next to Home / Chat / Files, one click from whatever you keep coming back to.

Pinning used to be restricted to files at the project root; since v0.42
that gate is gone, so a design/plan.md or src/lib/auth.ts pins just as well.
A nested tab shows just the basename to stay compact — hover it for the full
project-relative path.
Review and commit: the Changes tab
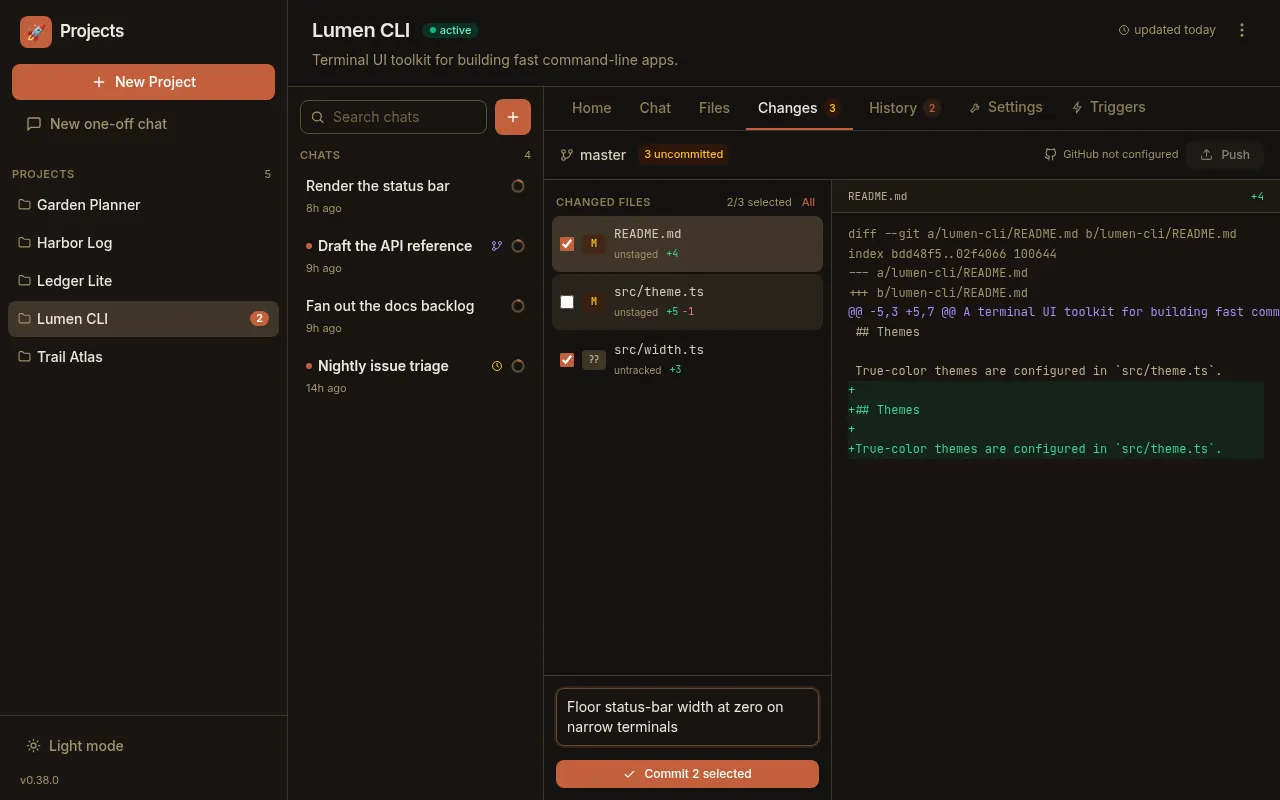
Section titled “Review and commit: the Changes tab”For a project whose store is a git repo, the Changes tab is where you turn
Claude’s edits into commits. It lists every uncommitted file with its status
(added / modified / deleted / renamed / untracked) and a per-file +A −B line
stat; selecting a file shows its diff, with a matching stat in the diff header.
Untracked files show their new content rather than an empty diff.
The commit is selective. Each file has a checkbox (with a select-All /
None toggle and a running N/M selected count), so you can commit a subset
rather than everything at once. The commit button reflects the selection: it reads
Commit when everything is selected and Commit N selected when you’ve
narrowed it down.
You don’t have to open a project to notice it has pending work: the projects
grid flags each project’s uncommitted-file count with a small amber pill (a
branch icon and the count), fed by a single cheap git status over the whole
store — so a checkpoint that’s waiting to be made is visible before you even
click in.
Branch or rewind from what you just read
Section titled “Branch or rewind from what you just read”Reviewing often turns into “let me try a variation from here.” Forking a chat copies its full history into a new, independently resumable chat (see Chats are sessions). Paddock lets you name the fork up front: the Fork dialog opens with a Fork name field pre-filled with “Fork of ⟨chat⟩”, selected so a keystroke replaces it — so the branch lands in your sidebar with a meaningful title instead of an auto-summary you have to rename later.
You can also branch from a specific point rather than the whole chat. Hovering any message reveals Fork a new chat from here (which copies only the transcript up to that message) and Revert conversation back to here (which truncates this chat in place, backing the discarded tail up). That’s the move when a review tells you Claude went wrong at an identifiable step — rewind to just before it, or branch and try the other approach. See the per-message rail for the details, including the important caveat that reverting rewinds the conversation, not the files, PRs or messages Claude already produced.
Next steps
Section titled “Next steps”- Provenance: who did what — the origin and per-message attribution behind the chats you’re reading.
- Working in chats — the composer, queue, Stop, unread dots, and the context + cost meter in day-to-day use.
- Chats are sessions — persistence, resume, and forking.
- The sweeper — the post-turn curation that keeps a
project’s
OVERVIEW.mdandCHANGELOG.mdcurrent.